Every day, millions of retail forex traders open their charts, apply a standard set of technical indicators, and look for the exact same setups. They wait for the Relative Strength Index (RSI) to cross above the 30-line to signal an oversold bounce. They watch for a Moving Average Convergence Divergence (MACD) crossover. They paint clean, parallel support and resistance lines across their screens, believing they have mapped out the geometry of the global financial markets.
Then, they place their orders, set their stop losses right behind the recent swing low, and watch the market immediately move against them.
The breakout turns into a fakeout. The rock solid support level shatters, triggers their stop loss, and instantly reverses in the direction they originally predicted. It feels personal. It feels rigged.
The truth is, the market is not personal, but it is structurally adversarial. If you are relying entirely on traditional retail indicators, you are viewing the market through a lagging lens. While retail traders are obsessing over historical price charts, commercial banks, market makers, and institutional algorithms are focusing exclusively on one thing: order flow liquidity.
To stop being the liquidity that institutional entities feed on, you must understand how smart money operates, why your traditional tools fail, and how global capital actually transfers risk across the foreign exchange market. For a comprehensive deep dive into how institutional volume shapes everyday trends, you can explore the technical archives found on the official PipInfuse market insights archive.
The Lagging Indicator Trap: Why Oversold and Overbought Signals Lead to Capital Loss
The foundational mistake made by the vast majority of retail participants is mistaking historical derivative mathematical formulas for real time market drivers. Indicators like the RSI, Stochastic Oscillator, and MACD do not see where the market is going, they simply summarize where price has already been.
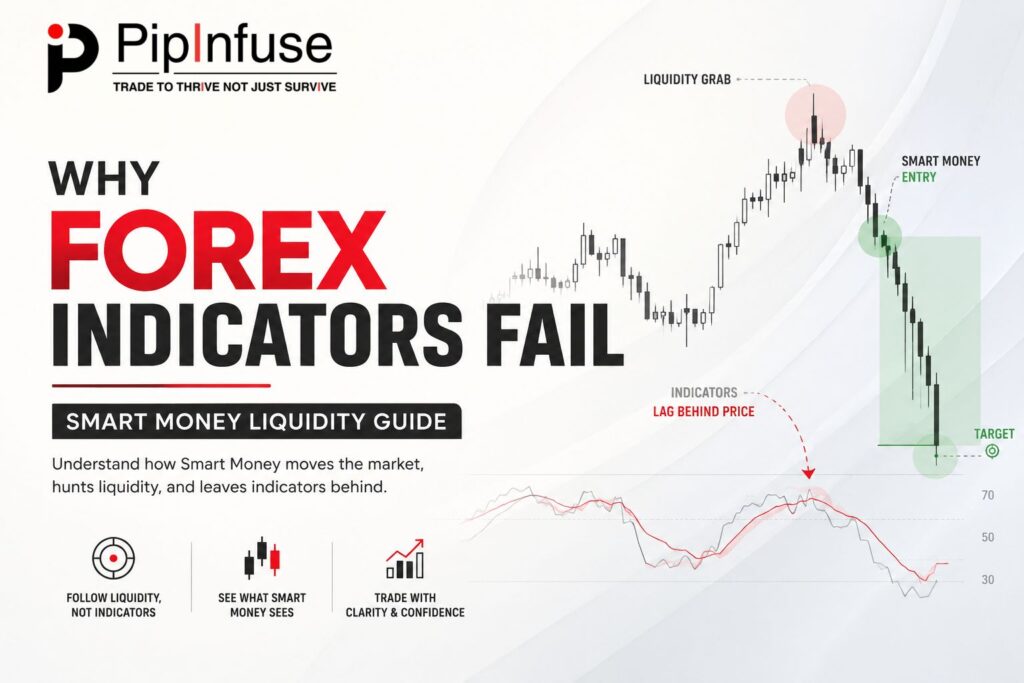
When you look at an RSI reading that shows a major currency pair like EURUSD is oversold below 30, the retail mindset assumes selling pressure is exhausted. In reality, a deeply depressed indicator reading simply reflects strong, downside directional momentum.
Institutional algorithms, the high frequency systems driving central bank execution corridors and massive commercial flows, do not check if a moving average has crossed over before executing a trade. They operate via order book math. If a major institutional participant needs to accumulate a multi billion dollar long position, they cannot simply hit the market buy button without driving the price up against themselves, destroying their own average entry price.
Instead, they require an equal and opposite volume of sell orders to match their buy interest. Where do they find a massive concentration of urgent sell orders? They find them directly beneath obvious, heavily publicized retail support levels, disguised as retail sell stop losses.
When your lagging indicators scream buy the bounce, the institutional engine is frequently preparing to drive the market lower to clear out those exact buyers, triggering a cascade of stop orders that provides the necessary liquidity to fill their institutional buy book.
What Is Liquidity? Understanding the Mechanical Reality of the Order Book
To transition your trading architecture toward modern smart money concepts forex strategies, you must abandon the abstract idea that prices move because a line was broken. Prices move solely due to supply and demand imbalances within the interbank order book.
In its simplest form, liquidity represents the ease with which an asset can be bought or sold without causing a significant shift in its price. In the global forex ecosystem, liquidity is the lifeblood of every transaction.
Every single trade requires a counterparty:
- For every buyer, there must be a seller.
- For every short position that wants to take profit, a buy order must be executed.
- For every retail stop loss triggered on a long position, a market sell order is dumped into the book.
Large-scale institutional players, such as sovereign wealth funds and tier-one investment banks, handle block orders so massive that they cannot operate within normal daily price ranges without experiencing severe slippage. If an institution attempts to enter the market blindly, they face poor execution fills that erode their profit margins. Managing this massive institutional exposure requires an analytical approach that aligns with structural capital flows rather than lagging indicators. If you are looking to build a sustainable trading career, PipInfuse operates as a premier Forex trading and investment management consultancy designed to help you navigate these precise institutional realities.
Therefore, institutional execution is entirely parameter driven. They do not trade based on chart patterns; they trade based on liquidity pools—geographic zones on a chart where a massive concentration of pending orders is known to sit. By understanding this mechanical reality, you begin to see that the market moves not to fulfill geometric patterns, but to seek out pockets of unexecuted capital to facilitate order matching.
Why Support and Resistance Really Break: Order Clustering vs. Magical Lines
Retail textbooks teach that the more times a support or resistance level is tested, the stronger it becomes. From an institutional risk perspective, the exact opposite is true. The more times a level is tested, the more fragile it becomes because the volume of orders resting behind that level increases exponentially.
Think about how retail traders are trained to manage risk. When a support level forms on a major pair like GBPUSD or USDCAD, thousands of traders place buy orders at the bounce. To protect their capital, they cluster their protective stop losses a few pips directly below that support line.
To an institutional algorithm, that cluster of stop losses is not a barrier, it is a giant target. Those stop losses represent a massive pool of sell stop orders resting in wait. If a large player wants to buy GBPUSD at a deep discount, they will deliberately manipulate the price downward, pushing it through the support level.
[Retail Support Line] ---------------------------------------------
      ▲   ▲   ▲   (Retail Buyers Enter on Multiple Bounces)
======│===│===│====================================================
      ▼   ▼   ▼   [THE LIQUIDITY POOL]
                  (Clusters of Sell-Stop Losses Resting Here)
                  Institutional Algorithms Drive Price Down to Clear This Zone
This structural movement is not a random anomaly, it is a calculated transfer of risk. The moment those retail stop losses are triggered, they turn into market sell orders. The institution smoothly buys up those sell orders at wholesale prices.
The magical support line did not break because the market lacked buyers; it broke because it was mechanically engineered to clear out the resting order clusters to facilitate institutional positioning.
How to Identify Liquidity Sweeps and Stop Hunts Without Panic
Once you understand that institutional forex liquidity manipulation is a required component of market mechanics rather than an malicious broker conspiracy, you can learn to read the footprints left by these algorithms. True trading longevity requires access to institutional-grade execution environments. Through our strategic partnerships, we guide our clients toward vetted institutional infrastructure and multi-regulated brokers, ensuring your trades are processed with deep liquidity and absolute transparency. This shift in perspective is what separates consistently profitable macro practitioners from those trapped in the retail cycle.
To protect your capital and find high probability entry points, you must master the identification of the Liquidity Sweep (often referred to as a stop hunt).
1. Locate the Obvious Pools
Look at your charts and identify clean double tops, double bottoms, or obvious swing highs and lows that have remained untouched for several sessions. Do not view them as trade entries. View them as zones where massive retail stop loss volume is currently clustering.
2. Observe the Character of the Breakout
When price approaches these liquidity pools, watch the price action closely. A true institutional expansion breakout will typically feature strong, full bodied candles closing well beyond the level on high volume.
Conversely, an institutional liquidity sweep will show price piercing through the level momentarily, often via a long, aggressive candle wick, only to sharply reject the zone and close back inside the old trading range.
3. Wait for the Market Structure Shift
To trade alongside smart money rather than against it, never try to catch the falling knife during a rapid liquidity hunt. Wait for the sweep to complete.
Once the algorithm has successfully captured the resting liquidity pool, look for a sharp, aggressive counter movement that breaks the immediate internal market structure in the opposite direction. This displacement proves that institutional capital has stepped in, leaving a clean footprint you can safely follow.
Elevating Your Strategy Beyond the Retail Blueprint
To transition from a speculative mindset to an institutional frame of reference, you must treat trading as an exercise in institutional liquidity distribution and strict risk mitigation. For serious market participants looking to scale their operations, we provide access to bespoke risk first Forex Solutions engineered to optimize performance while maintaining strict risk parameters.
Stop viewing the market through the eyes of a retail chartist. By expanding your technical knowledge to embrace global capital flows, order book mechanics, and order blocks, you protect your capital from predatory algorithms. Furthermore, maximizing long-term profitability requires that you couple your liquidity analysis with strict algorithmic drawdown management to insulate your account from unexpected geopolitical market shocks. Realign your technical toolkit with the banks, track the footprints of smart money, and leave lagging indicators behind for good.
About the Author
Bhagesh Nair is a veteran financial market strategist with over 12 years of hands on experience navigating global currency corridors, sovereign debt correlations, and high volatility precious metals markets. As the founder of PipInfuse, Bhagesh champions a strict, risk first methodology that strips away conventional retail trading myths in favour of institutional liquidity tracking, macroeconomics, and transparent capital preservation strategies.